

Multi Time Frame Support and Resistance Indicator TradingView is one of the most powerful tools for traders who want accurate chart levels across different timeframes. Instead of manually drawing zones, this indicator automatically detects key support and resistance levels, saving time and improving trade accuracy.
With AlgoFlux SwingX Pro, traders can analyze multiple timeframes simultaneously and get clear entry and exit signals. Whether you trade intraday or swing, this TradingView indicator ensures you never miss important support or resistance zones.
Why Multi Time Frame Support & Resistance Matters
- Better Accuracy – Levels from higher timeframes (Daily/Weekly) are stronger and more reliable.
- Improved Entries – Lower timeframe levels (1H/2H) refine entry points with precision.
- Reduced Noise – Avoid false signals by combining multiple timeframe confirmations.
- Swing & Intraday Edge – Perfect for both swing traders and intraday scalpers.
By combining different perspectives, you gain a 360-degree view of market behaviour.

Best Multi Time Frame Support and Resistance Indicator TradingView
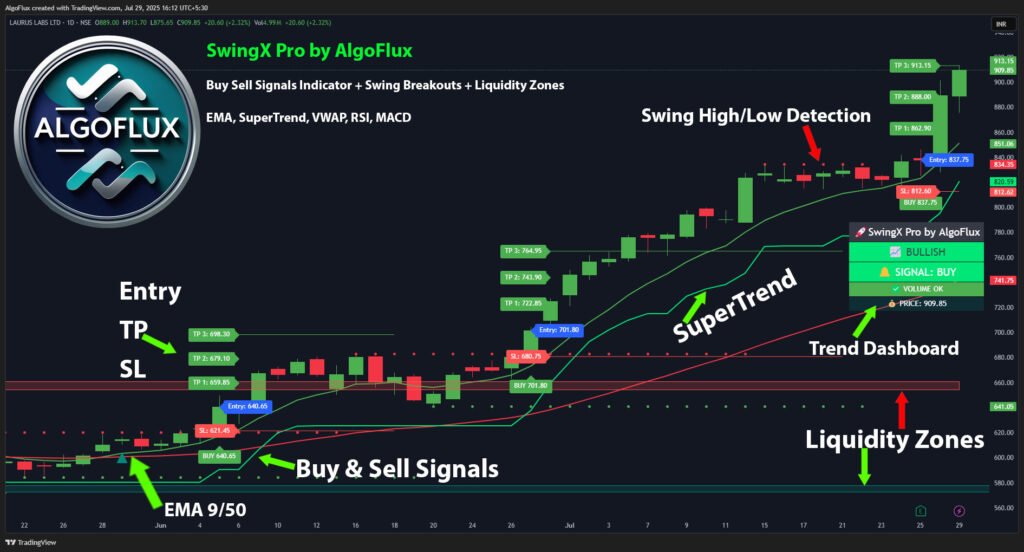
The AlgoFlux SwingX Pro includes advanced auto support and resistance detection with multi time frame capability. It helps traders spot high-probability zones instantly without manual drawing.
👉 Key Features:
- Auto plots support & resistance from multiple timeframes.
- Combines them into clean zones for better visibility.
- Works for swing, positional, and intraday trading.
- Compatible with all asset classes on TradingView.
- Alerts for breakout and retest setups.
If you’re looking for the best TradingView indicators, check our full collection:
- TradingView Indicators
- TradingView Support & Resistance Indicators
- Best Swing Trading Indicator for TradingView
How to Use Multi Time Frame Support and Resistance
- Select Higher Timeframe Zones – Mark weekly and daily support/resistance.
- Confirm with Lower Timeframes – Validate with 2H or 1H charts for entries.
- Wait for Breakouts or Bounces – Look for price action confirmation.
- Set Stop Loss & Targets – Place SL below/above support or resistance.
- Trail for Profits – Use AlgoFlux SwingX Pro’s live dashboard for dynamic SL/TP.
This structured approach minimizes risk and maximizes reward.
External Resource
Want to Buy?
Follow us on TradingView and DM us directly 👉 AlgoFlux
FAQs on Multi Time Frame Support and Resistance Indicator
Q1: Is this indicator free on TradingView?
Some free versions exist, but most are unreliable. AlgoFlux provides a premium, professional-grade solution.
Q2: Can it be used for forex and crypto?
Yes, the indicator works across all TradingView assets – stocks, forex, crypto, and commodities.
Q3: How does it differ from a normal support/resistance tool?
It combines multiple time frame levels automatically, reducing errors and improving accuracy.
Q4: Is AlgoFlux SwingX Pro beginner-friendly?
Absolutely. Even beginners can trade with confidence as the tool provides ready-to-use levels.
Conclusion
A Multi Time Frame Support and Resistance Indicator for TradingView gives traders an unmatched advantage by combining higher and lower timeframe levels. With AlgoFlux SwingX Pro, you get automatic support and resistance zones, live alerts, and clean visual charts.
👉 Start improving your trades today with SwingX Pro – Best Swing Trading Indicator for TradingView.