

Introduction
Best technical indicators for swing trading are essential for traders who want consistent profits in volatile markets. Indicators like moving averages, RSI, MACD, and volume-based tools help traders identify buy and sell signals with high accuracy. In this guide, we’ll explore the most powerful technical indicators for swing trading, explain how they work, and show you how AlgoFlux’s TradingView tools can improve your results.
Why Technical Indicators Matter in Swing Trading
Swing trading aims to capture short- to medium-term price moves. Unlike long-term investing, swing traders rely on precise entry and exit points. Technical indicators provide:
- Confirmation of trend direction
- Momentum signals for buy/sell decisions
- Support & resistance levels for risk management
- Volume analysis to validate market strength
By using the right trading technical indicators, you reduce emotional trading and improve decision-making.
Swing Trading Indicators That Help Identify Trends and Reversals
Swing trading indicators are designed to help traders capture medium-term price movements that typically last from a few days to several weeks. These indicators focus on identifying trend direction, momentum strength, and potential reversal zones so traders can plan structured entries and exits. Tools such as moving averages, RSI, MACD, and volume analysis are commonly used as swing trading indicators because they provide a clearer view of trend continuation and exhaustion points.
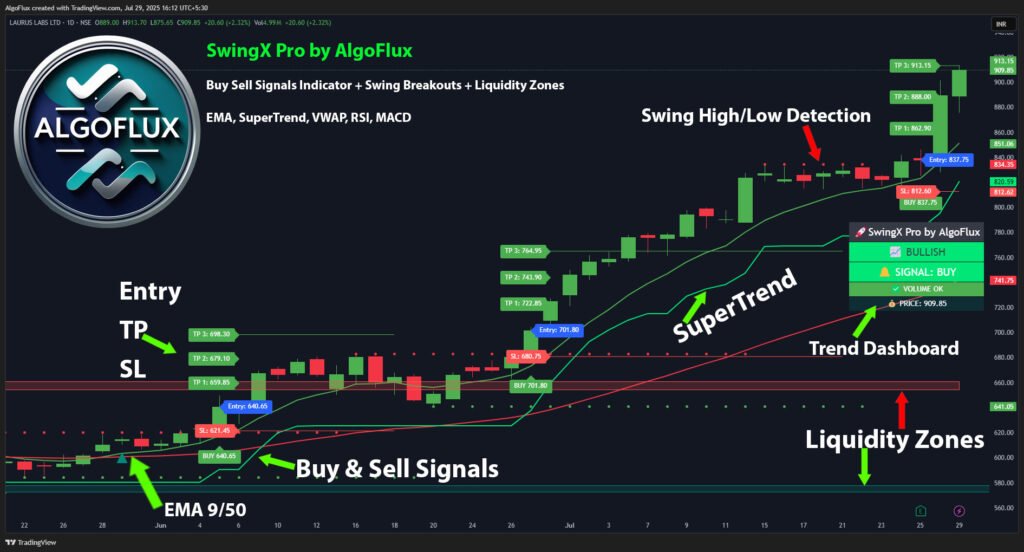
The SwingX Pro by AlgoFlux TradingView indicator combines multiple swing trading indicators into a single dashboard, allowing traders to monitor trend alignment, momentum shifts, and key price levels without applying multiple separate indicators on the chart.
Best TradingView Indicator for Swing Trading – What Traders Should Look For
When searching for the best TradingView indicator for swing trading, traders typically look for tools that provide multi-timeframe trend analysis, non-repainting signals, and visual risk management zones. Swing trading requires patience and clarity, so an effective indicator should reduce noise and highlight only meaningful market movements rather than generating excessive signals.
The SwingX Pro by AlgoFlux TradingView indicator is designed with these requirements in mind. It integrates trend filters, momentum indicators, and market structure analysis into one interface, helping swing traders focus on high-quality setups and maintain disciplined trade management throughout the duration of a swing trade.
Best Indicators for Swing Trading to Improve Trade Planning
The best indicators for swing trading are those that help traders identify trend direction early while also providing confirmation before entering a trade. Popular combinations include exponential moving averages for trend detection, RSI for momentum confirmation, and volume indicators to validate breakouts or reversals.
Instead of using these tools separately, many traders prefer an integrated approach. The SwingX Pro by AlgoFlux TradingView indicator combines these commonly used indicators into a structured system, enabling traders to analyze potential swing opportunities, monitor trend strength, and plan stop-loss and target levels directly from the chart.
📊 Best Technical Indicators for Swing Trading
1. Moving Averages (MA)
Moving averages smooth price data to identify trends. For swing traders, EMA (Exponential Moving Average) is more effective than SMA because it reacts quickly to price changes.
- 9 EMA & 50 EMA crossover is a popular swing setup.
- When 9 EMA crosses above 50 EMA → Buy Signal.
- When 9 EMA falls below 50 EMA → Sell Signal.
👉 Try AlgoFlux SwingX Pro Indicator which combines EMA crossovers with volume and RSI for more accurate signals.
2. Relative Strength Index (RSI)
The RSI indicator measures momentum and overbought/oversold conditions.
- RSI above 70 = Overbought (possible reversal down).
- RSI below 30 = Oversold (possible reversal up).
- RSI divergence with price often signals trend change.
💡 Combine RSI with support & resistance for high-probability trades. AlgoFlux offers advanced TradingView Support & Resistance Indicators that pair well with RSI setups.
3. Moving Average Convergence Divergence (MACD)
MACD is one of the best stock technical indicators for swing trading. It measures momentum and trend changes using two moving averages.
- MACD line crossing above Signal line = Bullish.
- MACD line crossing below Signal line = Bearish.
- Histogram shows strength of momentum.
For short-term trading, MACD + EMA crossovers create strong confirmation signals.
4. Bollinger Bands
Bollinger Bands help traders identify volatility and price extremes.
- Price touching upper band = overbought.
- Price touching lower band = oversold.
- Bands tightening = consolidation before breakout.
👉 AlgoFlux’s Best Swing Trading Indicator for TradingView integrates Bollinger logic with volume confirmation for precise buy/sell calls.
5. SuperTrend Indicator
The SuperTrend indicator is a trend-following tool that works well in swing trading.
- When the price closes above the SuperTrend line → Buy.
- When it closes below → Sell.
- Works best with volatility filters like ATR.
This indicator is especially powerful in trending markets and widely used on TradingView.
6. Volume Indicators
Volume technical indicators confirm the strength of price moves.
- On-Balance Volume (OBV): Measures buying vs. selling pressure.
- Volume Profile: Shows price levels with highest activity.
- Volume Weighted Average Price (VWAP): Helps find fair value zones.
👉 AlgoFlux integrates volume confirmation in SwingX Pro, ensuring signals are backed by real trading activity.
7. Fibonacci Retracement
Fibonacci retracement levels help identify potential reversal zones. Swing traders often use 38.2%, 50%, and 61.8% levels as entry/exit points.
When combined with other intraday technical indicators, Fibonacci gives a strong edge in timing trades.
8. Stochastic Oscillator
This oscillator compares closing price to price range over a period.
- Above 80 = Overbought.
- Below 20 = Oversold.
- Works best in range-bound swing setups.
Traders often combine Stochastic with RSI for confirmation.
9. Support & Resistance Indicators
Support & resistance levels are critical technical indicators for swing trading. They act as barriers where price tends to bounce or reverse.
AlgoFlux provides a powerful Auto Support & Resistance Indicator for TradingView that dynamically plots levels across multiple timeframes.
10. ATR (Average True Range)
ATR measures market volatility and helps set stop loss levels. Swing traders can use 1.5x ATR for stop losses to avoid false exits.
This ensures better risk management and helps protect capital during swings.
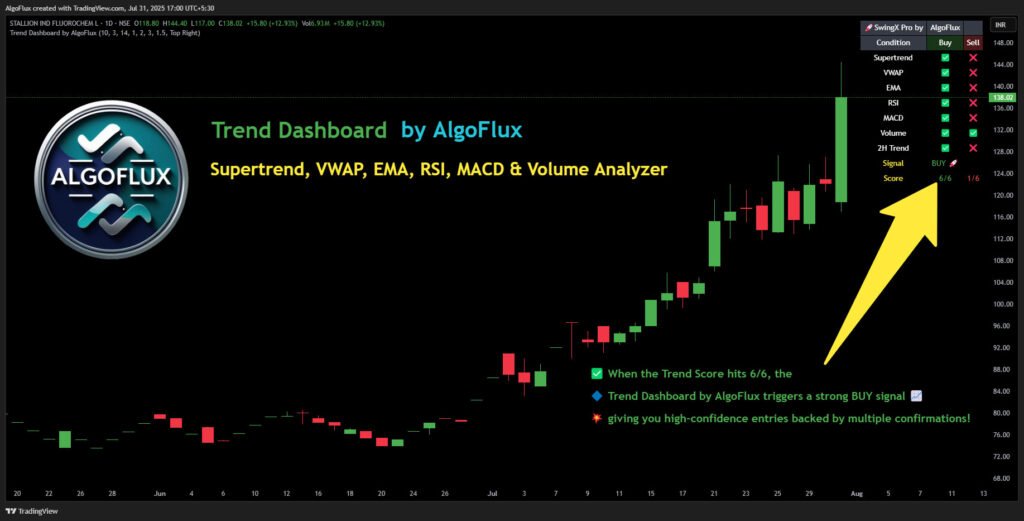
How to Combine Technical Indicators for Swing Trading
Instead of relying on one tool, the best approach is indicator confluence:
- Trend → Moving Averages + SuperTrend
- Momentum → RSI + MACD
- Volatility → Bollinger Bands + ATR
- Volume → OBV + VWAP
- Levels → Support & Resistance + Fibonacci
👉 For a ready-made solution, AlgoFlux has already combined these in SwingX Pro, making it the best buy sell indicator for TradingView.
Want to Buy the Best Technical Indicators for Swing Trading?
Follow us on TradingView and DM us on TradingView. AlgoFlux
📌 Bro Buy SwingX Pro & Trade as a Pro
If you want to trade smarter with accurate signals, explore our Best Swing Trading Indicator for TradingView – SwingX Pro today.
Frequently Asked Questions – Best Technical Indicators for Swing Trading
The best technical indicators for swing trading are those that help identify trend direction, momentum shifts, and potential reversal zones. Commonly used indicators include moving averages, RSI, MACD, and volume analysis, as they provide a balanced view of market structure and price behavior over multi-day timeframes.
Reliable swing trading indicators are those that provide consistent signals without excessive noise. Traders often prefer indicators that combine trend confirmation and momentum analysis, such as EMA crossovers, RSI levels, and MACD histogram shifts. Using multiple indicators together can help reduce false signals and improve trade planning.
The best TradingView indicator for swing trading is typically one that integrates multiple technical tools into a single dashboard, reducing chart clutter and simplifying decision-making. Indicators that provide multi-timeframe trend analysis, non-repainting signals, and clear risk management zones are generally preferred by swing traders.
Technical indicators for swing trading help traders analyze price momentum, trend strength, and support/resistance levels. By combining trend indicators like moving averages with momentum indicators such as RSI, traders can identify potential entry points during pullbacks and exit points when momentum begins to weaken.
Using multiple technical indicators for swing trading can improve confirmation and reduce reliance on a single signal. However, adding too many indicators may lead to confusion and conflicting information. A balanced combination of trend, momentum, and volume indicators is often considered more effective than relying on one indicator alone.
Yes, beginners can use swing trading indicators effectively if they focus on understanding a few key indicators rather than trying to use many at once. Learning how moving averages, RSI, and MACD interact with price action can help new traders develop a structured approach to swing trading.
The best indicators for swing trading depend on your trading style, timeframe, and risk tolerance. Trend-following traders may rely more on moving averages and trend dashboards, while reversal traders may focus on momentum indicators like RSI and divergence patterns. Backtesting and paper trading can help determine which indicators suit your strategy.
Yes, most swing trading indicators work across different markets, including stocks, indices, forex, and cryptocurrencies. Since these indicators are based on price and volume data, they can be applied to any market available on charting platforms like TradingView.
Yes, TradingView offers free indicators, but premium tools like AlgoFlux provide more accuracy.
EMA crossovers, RSI, and MACD work well for short-term swing trades.
Volume indicators like OBV and VWAP confirm the strength of trends and breakouts.
AlgoFlux SwingX Pro is considered one of the most accurate non-repainting buy/sell indicators.