


Finding the Most Accurate Buy Sell Indicator TradingView is a priority for traders across stocks, forex, and crypto markets. However, experienced traders understand that consistency comes from a structured approach, not a single signal. This guide explains: 🧠 What Makes a Buy Sell Indicator Reliable? A high-quality indicator should provide: 👉 This is why professional […]

30
Aug
Aug
Bollinger Bands & Vortex Indicator are two of the most widely used swing trading indicators in the Indian stock market. Traders often rely on them to identify volatility, detect breakouts, and confirm trend direction. When used together, Bollinger Bands & Vortex Indicator provide a robust trading strategy that balances market volatility analysis with clear trend […]

30
Aug
Aug
The SuperTrend indicator strategy is one of the most popular trading approaches among swing traders in India and worldwide. Built on the principles of trend-following and volatility, the SuperTrend indicator gives clear buy and sell signals, making it a favorite tool on platforms like TradingView. If you’re struggling with late entries, false breakouts, or inconsistent […]

30
Aug
Aug
Swing trading indicators in Indian stock market are essential tools for traders who want to capture medium-term price moves in NSE and BSE listed stocks. Unlike intraday traders, swing traders hold positions for a few days to weeks, and having the right indicator helps them spot high-probability entries, manage risk, and maximize profits. In this […]
TradingView Support & Resistance Indicators
Support And Resistance Indicator TradingView Name (2025 Guide) | AlgoFlux

30
Aug
Aug
Introduction Support And Resistance Indicator TradingView Name is one of the most searched terms among traders looking for accurate tools to mark price zones. Support and resistance indicators are the backbone of technical analysis, helping traders identify levels where markets are likely to reverse or consolidate. While some traders manually draw these zones, TradingView simplifies […]
TradingView Support & Resistance Indicators
Dynamic Support and Resistance Indicator TradingView | AlgoFlux
30
Aug
Aug
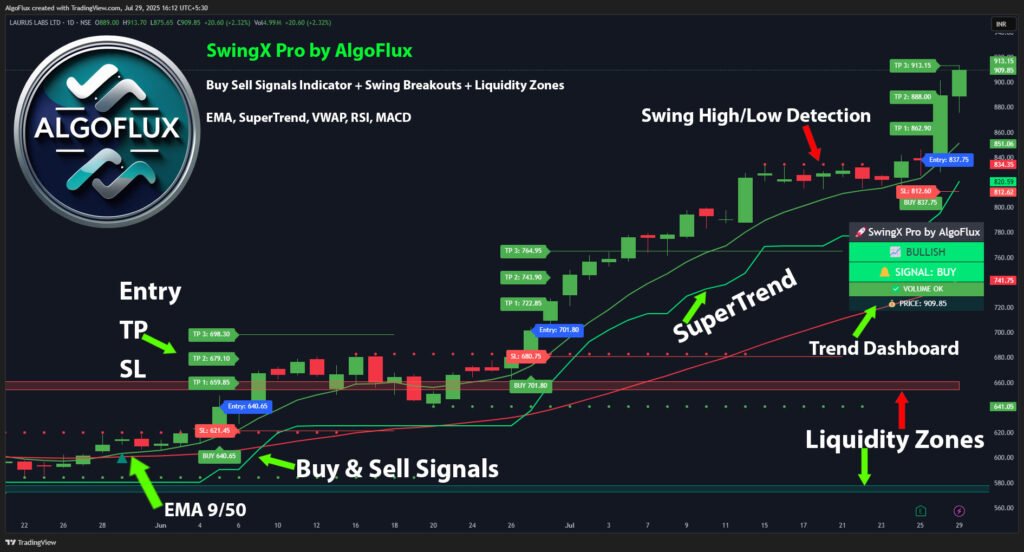
Dynamic Support and Resistance Indicator TradingView is a must-have tool for traders who want to identify real-time price levels that adapt to market volatility. Unlike fixed horizontal lines, this indicator automatically shifts with the trend, making it far more reliable for modern trading strategies. For anyone trading on TradingView, using a dynamic support and resistance […]
TradingView Support & Resistance Indicators
Best Support and Resistance Indicator TradingView Free (2025 Guide)

30
Aug
Aug
Support and resistance levels are the backbone of technical analysis, helping traders identify entry and exit points with confidence. If you are searching for the best support and resistance indicator TradingView free, you’re in the right place. Many traders struggle to plot accurate levels manually, but with the right indicator, you can automatically detect dynamic […]
TradingView Support & Resistance Indicators
Multi Time Frame Support and Resistance Indicator for TradingView – AlgoFlux
29
Aug
Aug
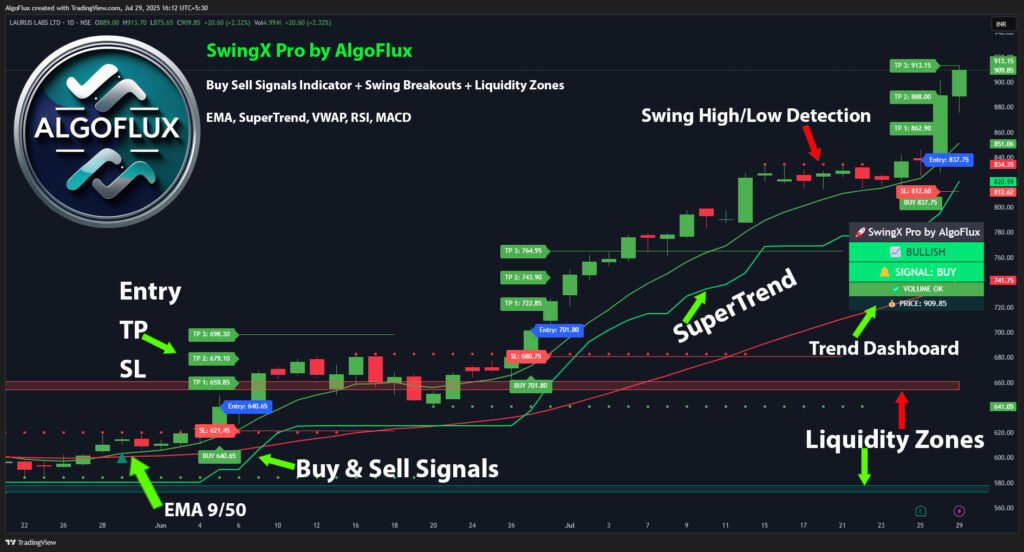
Multi Time Frame Support and Resistance Indicator TradingView is one of the most powerful tools for traders who want accurate chart levels across different timeframes. Instead of manually drawing zones, this indicator automatically detects key support and resistance levels, saving time and improving trade accuracy. With AlgoFlux SwingX Pro, traders can analyze multiple timeframes simultaneously […]
TradingView Support & Resistance Indicators
Best Auto Support and Resistance Indicator TradingView (Free & Pro)
29
Aug
Aug
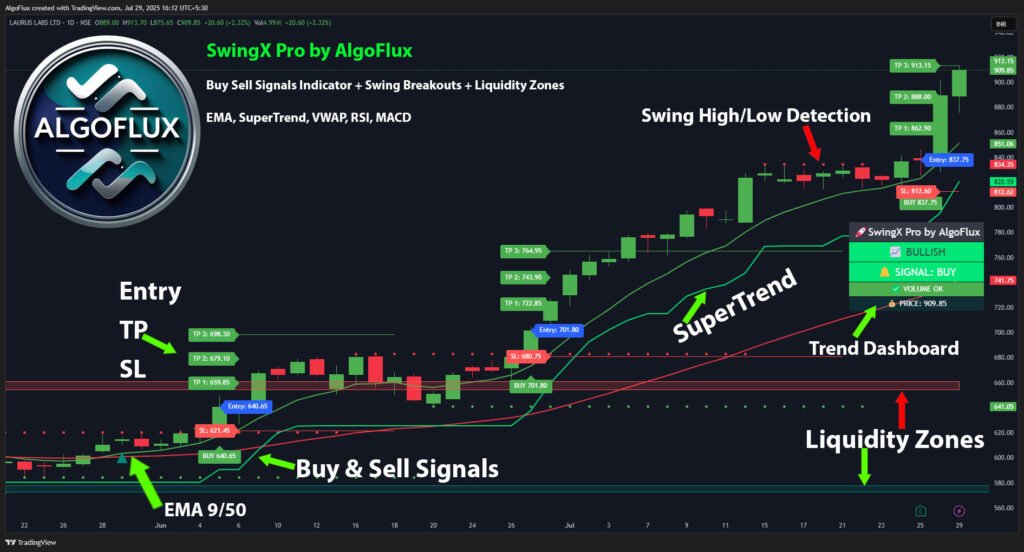
Support and resistance are the backbone of technical analysis. Traders spend hours marking levels manually, but with our Best Auto Support and Resistance Indicator TradingView (2025), you can simplify the process and trade with confidence. In this blog, we’ll explore the best auto support and resistance indicator for TradingView – the AlgoFlux SwingX Pro, why […]
TradingView Support & Resistance Indicators
Best TradingView Support & Resistance Indicators (Free & Pro) – AlgoFlux SwingX Pro

29
Aug
Aug
Support and resistance levels are the backbone of technical analysis. For traders using TradingView, finding the Best Support and Resistance Indicator Tradingview can be the difference between winning trades and missed opportunities. A reliable Support and Resistance Indicator Tradingview helps traders identify key price zones, improve entry timing, and manage risk with greater confidence. In […]