

Dynamic Support and Resistance Indicator TradingView is a must-have tool for traders who want to identify real-time price levels that adapt to market volatility. Unlike fixed horizontal lines, this indicator automatically shifts with the trend, making it far more reliable for modern trading strategies.
For anyone trading on TradingView, using a dynamic support and resistance indicator helps you quickly understand where buyers and sellers are most active. Whether you trade intraday, swing, or long-term, this feature allows you to capture trend reversals, breakouts, and strong entry/exit levels with confidence.
Why Use a Dynamic Support and Resistance Indicator?
- Adapts to Market Movements – Traditional static lines often fail when price trends strongly. Dynamic levels adjust with every candle.
- Works Across Timeframes – Useful for scalping, intraday, and swing trading.
- Filters Noise – Helps reduce false breakouts compared to manual drawing.
- Enhances Risk Management – Provides realistic stop-loss and take-profit levels.
- Boosts Accuracy – Increases the probability of trading at the right levels.
Features of Dynamic Support & Resistance Indicator on TradingView
- Auto Adjustment – No need to manually draw and adjust levels.
- Multi-Time Frame Compatible – Use it on 5-min, 15-min, Daily, or Weekly charts.
- Trend Adaptive – Follows momentum to spot stronger price zones.
- Smart Alerts – Get notified when price touches key levels.
- Clean & Minimal Design – Avoids clutter on charts.
👉 If you’re searching for the best support and resistance indicator on TradingView, the dynamic version is one of the most reliable choices.
👉 Want to Buy? Follow us on TradingView and DM AlgoFlux.
How AlgoFlux Improves Dynamic Support & Resistance
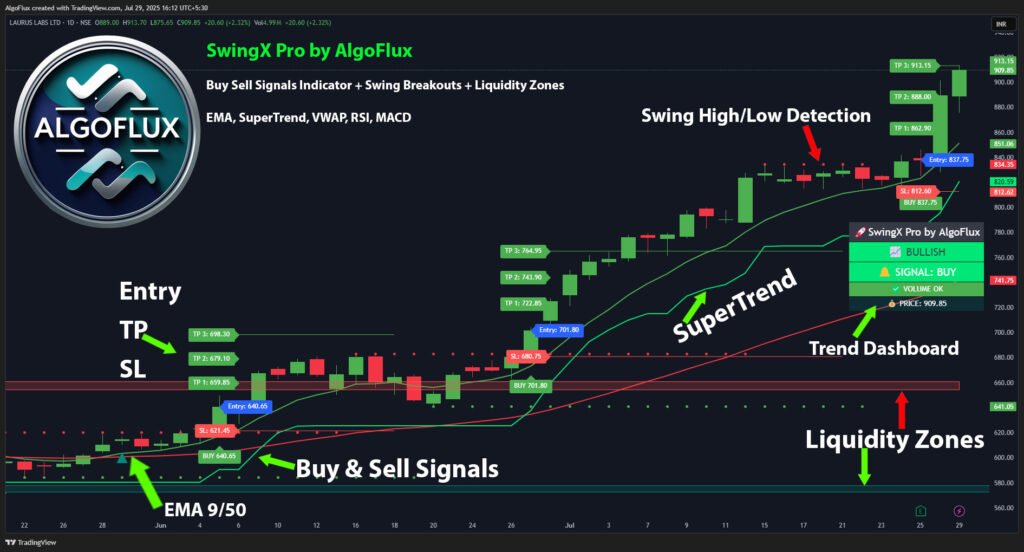
At AlgoFlux TradingView Indicator, we go beyond basic dynamic lines. Our tool integrates:
- Swing trading signals with real-time support/resistance
- Auto-buy/sell levels for quick decision making
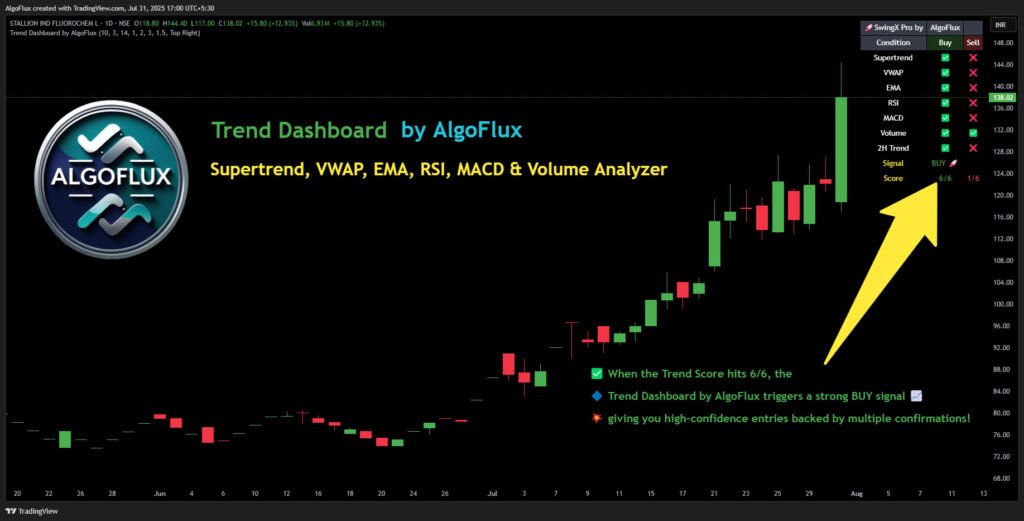
- Multi-timeframe analysis to confirm signals
- Mini dashboard for risk management
👉 Explore our premium solution here: Best Swing Trading Indicator for TradingView
FAQs
Q1. What is a Dynamic Support and Resistance Indicator?
It’s an automated tool that adjusts support and resistance levels as price changes, making them more accurate compared to static lines.
Q2. Is it better than manual support and resistance?
Yes, because it adapts in real-time and reduces human error, though many traders use both together.
Q3. Can I use it for intraday trading?
Absolutely. Dynamic support and resistance works for scalping, day trading, and swing strategies.
Q4. Does AlgoFlux include this feature?
Yes. AlgoFlux integrates dynamic support and resistance with advanced buy/sell logic and risk management.
Conclusion
The Dynamic Support and Resistance Indicator TradingView is essential for traders who want to keep up with fast-moving markets. By automatically adapting to volatility, it helps identify more accurate entry and exit points, making it a superior choice over static levels.
If you want to experience dynamic levels combined with advanced swing trading signals, try the AlgoFlux TradingView Indicator today.